
Composition of the Assessment Software
CASBEE has been developed to allow simple data entry from general-purpose spreadsheet software for various usage of assessment results. This section explains the CASBEE assessment software of CASBEE for New Construction as an example to present a basic assessment process of CASBEE in practice.
There are the Main Sheet and Score Entry Sheet for data entry and the Score Sheet and Assessment Results Sheet for output. The basic information on the building (building type, floor area, and so forth), necessary for assessment, is entered on the Main Sheet. The scoring criteria for the building under assessment are presented on the Score Entry Sheet, and the scoring results for each assessment item are input with reference to criteria. The Energy Calculation Sheet for data input for the LR1 Energy assessment, and the Consideration Record Sheet for detailed statements and the Emission Coefficient Sheet for LCCO2 assessment are also available.
Input Process
Main Sheet
The figure below shows the Main Sheet. The Main Sheet is the sheet where the assessor makes the first input. Enter the information necessary for the assessment, such as basic information on the subject building (name, type, size, and so forth). For the assessment of residential-type buildings, enter the floor area ratio between <Entire Building and Common Properties> and <Residential and Accommodation Sections>.
The basic information entered in the Main Sheet is transferred to the Assessment Results Sheet. Enter the average occupancy and the annual occupancy time where possible. These are for reference only and do not directly affect the CASBEE assessment.
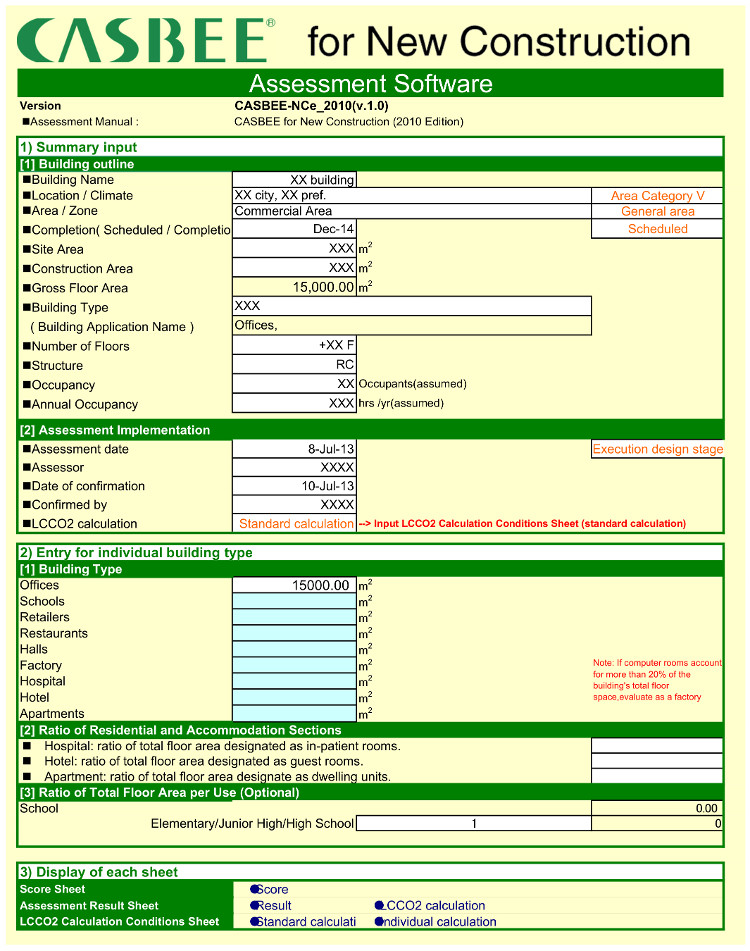
Fig10. Main sheet screen (date entry example)
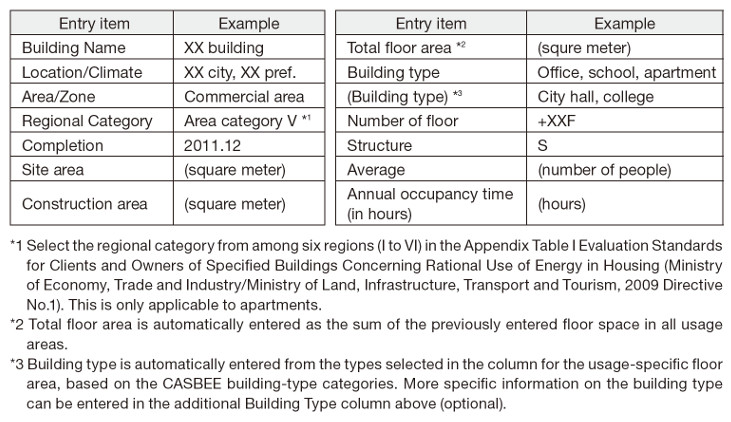
Table1. Entry items for Main sheet of CASBEE for New Construction
Score Entry Sheet
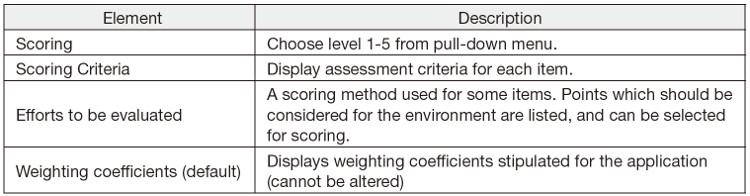
The Score Entry Sheet is where the assessor records the actual scores, evaluating grades of level 1-5 for each assessment item on the sheet, according to the stated assessment criteria. There are individual Score Entry Sheets for each assessment category, Q1 to 3 and LR1 to 3.
As shown in Figure 11, Score Entry Sheet displays a list of scoring criteria for each building type, and the assessor should assign points accordingly. The scoring criteria of "Entire Building and Common Properties" should be scored for all types in common. However, for residential building, the scoring criteria of "Residential and Accommodation Sections" should be scored as well.
Scoring criteria are set for levels 1-5, and the number for the level (e.g., "3" for level 3) should be chosen from the pull-down menu in the assessment column. If it is not possible to apply the scoring criteria as they stand, due to individual conditions in the target building, "Exclude" can be selected for some assessment items (items which can be excluded are listed in the commentary in the manual). If "Exclude" is selected, the excluded scoring items are assigned a weighting of "0" unless otherwise specified, and distributed according to the weighting of other scoring items.
When evaluating a building complex, enter the average of the levels (points) for all applicable building types, weighted for relative floor areas of each. Obtain the area-weighted average for each assessment item, and select the corresponding values from the pull-down list in the Score Entry Sheet. The averaged results are rounded to the nearest whole integer. For a more detailed assessment, the weighted averages in decimal form can be manually entered in the corresponding columns.
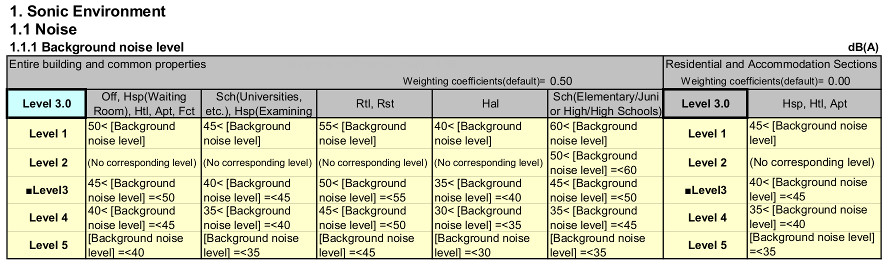
Fig11. Score Entry Sheet (example)
Table2. Entry items for Score Sheet of CASBEE for New Construction
Emissions Coefficient Sheet
Select the appropriate CO2 emissions coefficient for electricity use specific to the assessment objective. The assessment software allows use of the most recent actual emissions coefficient and alternative values. These values are based on the Ordinance on Calculation of Greenhouse Gas Emissions from Business Activities of Specified Emitters. The assessor may also choose and apply other appropriate emissions coefficients (optional). The figure Emissions Coefficient Sheet shows the coefficient selection form for electricity use.
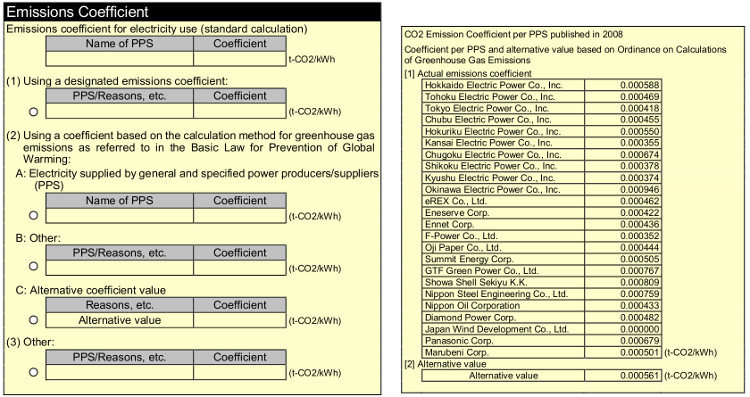
Fig12. Emissions Coefficient Sheet
Output results
Life Cycle CO2 Calculation Sheet
The figure 13 shows the Life Cycle CO2 (LCCO2) calculation sheet. The sheet displays the automatic calculation process for LCCO2 (the standard calculation) based on data entered in the Score Entry Sheet and the Energy Calculation Sheet.
Under each category of the building's life cycle stages (for example, construction, maintenance/upgrade/demolition and operation), the reference value (for a building rated as level 3 in all assessment categories except Energy and equivalent to the evaluation standard for building owners as specified in the Energy Conservation Law) and the CO2 emissions for the subject building are displayed in kg-CO2/year-m2.
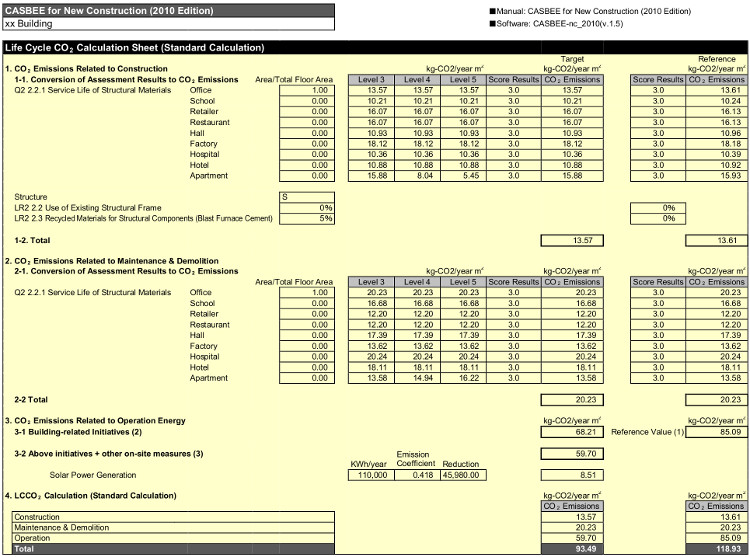
Fig13. LCCO2 Calculation Sheet (output example)
Score Sheet
The Score Sheet tabulates the results entered in the Score Entry Sheet. The corresponding weighting coefficients are applied to the score for each item, and the weighted values are combined. All scores, the total of each category from Q1 to Q3 (SQ1 to SQ3) and from LR1 to LR3 (SLR1 to SLR3), the combined total of all categories under Q (SQ) and the combined total of all categories under LR (SLR) are displayed automatically.
If the building under assessment is a residential-type building, the Score Sheet presents score results for <Entire Building and Common Properties> and for <Residential and Accommodation Sections> in parallel. The results are calculated as a weighted average according to the ratio of floor areas for each section to produce a score for the building as a whole. The scores weighted on a pro-rata basis entered in ratio of <Residential and Accommodation Sections> under building outline entry on the Main Sheet are displayed in the "Total" column as the final score for the evaluated building.
In the "Summary of Environmental Conscious Efforts in Design" column, state the specific details of the efforts on which the score is based, particularly for when over 3 points (level 3) is awarded.
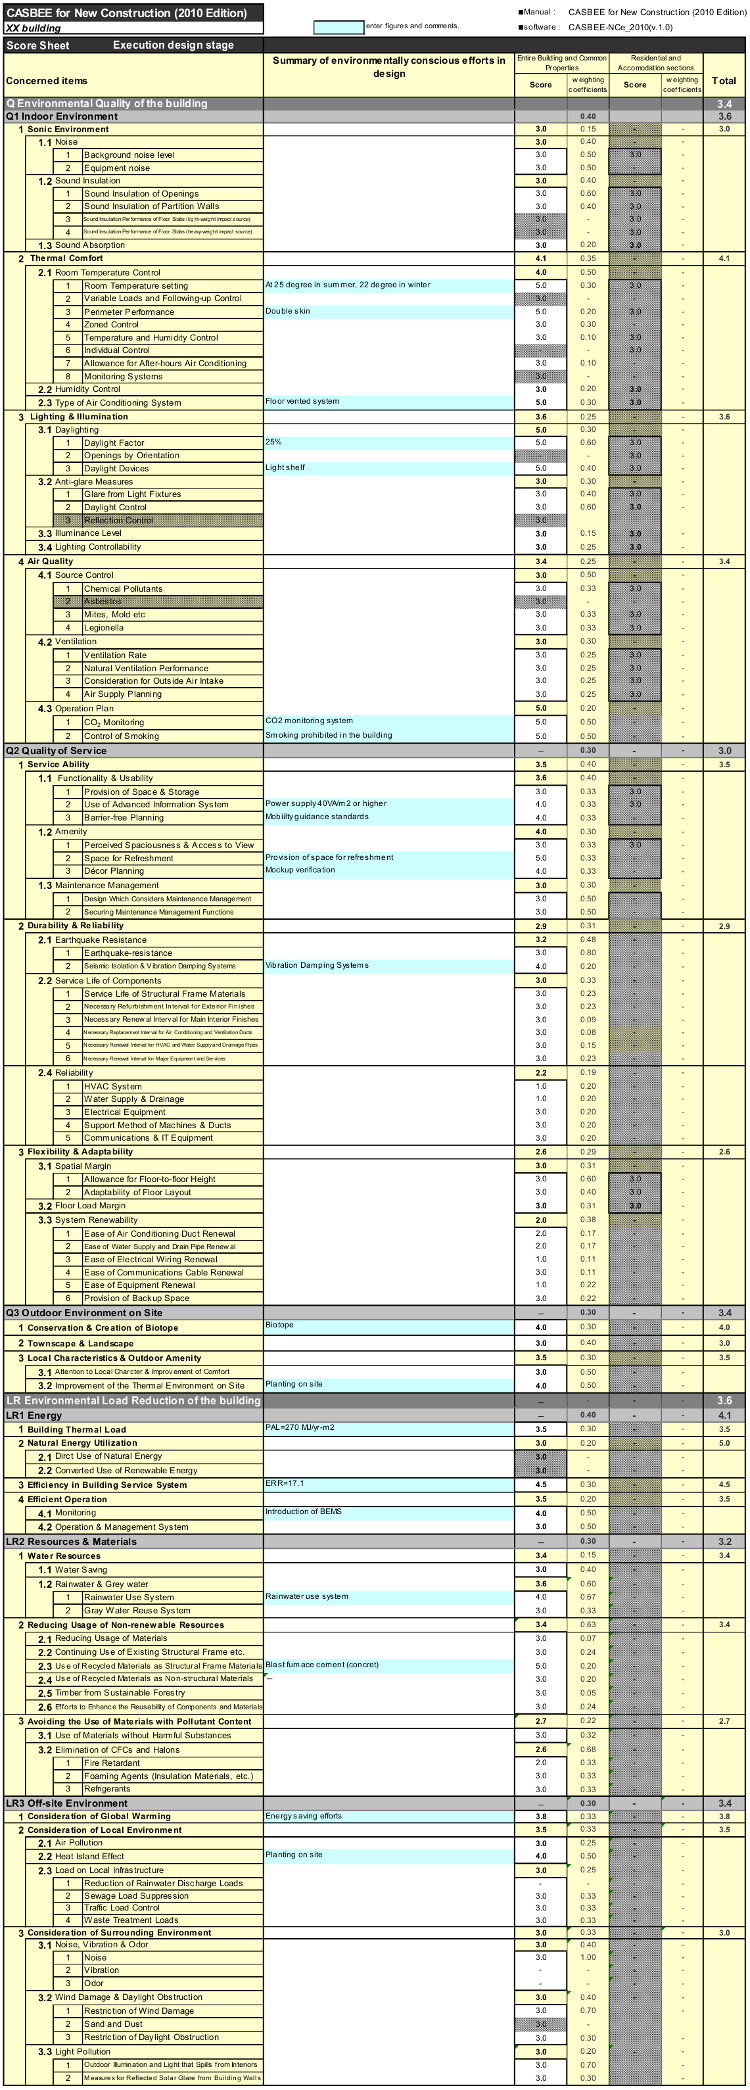
Fig14. Score Sheet
Assessment Results Sheet
The Assessment Results Sheet shows the assessment results of Q (Environmental Quality of the building), LR (Environmental Load Reduction of the building), BEE (Built Environment Efficiency) and LCCO2 emission rates are shown in graph and numerical formats.
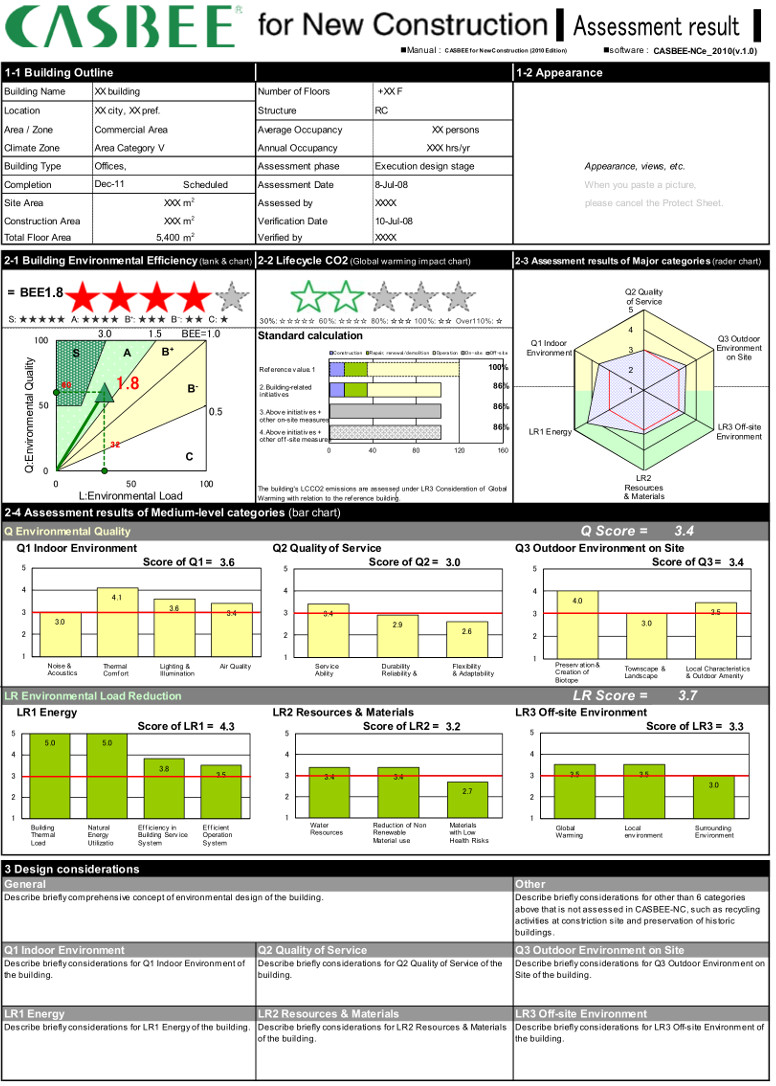
Fig15. Assessment Result Sheet of CASBEE-NC / Output example